Table of Contents
The success of an organization is tied directly to its people. For startups, this is critical because you aren’t just building a product; you are building a culture. Unlike legacy enterprises that rely on brand inertia, startups are the challengers defined by speed. To compete with tech giants and their massive budgets, you must “out-culture” them by fostering a superior employee experience (EX) across the entire lifecycle.
However, startups face the highest attrition rates in the market. Recent data shows Indian startup turnover hovering between 17% and 28%. This “talent debt” is a major growth killer, as replacing a mid-level employee can cost employers anywhere between 1.5x and 2x their annual salary.
Tracking the right data is therefore essential. These metrics serve as a diagnostic tool, showing whether your culture is trending upward or downward. For HR leaders, this data provides the evidence needed to fix “culture leaks” before they stall the company’s momentum.
What are HR Metrics?
HR metrics are the data points used to track how effectively an organization manages its people. These numbers provide a clear picture of the entire employee lifecycle, starting with the recruitment process and moving through daily engagement and final retention.
In 2026, these metrics have evolved. They are no longer just about tracking headcount or basic costs. Instead, they serve as a way to measure the actual quality of employee experience and the health of the company culture. By looking at these figures, leadership can make informed decisions based on facts rather than intuition.
Also read: 10 Ways to Improve Employee Experience in the Workplace
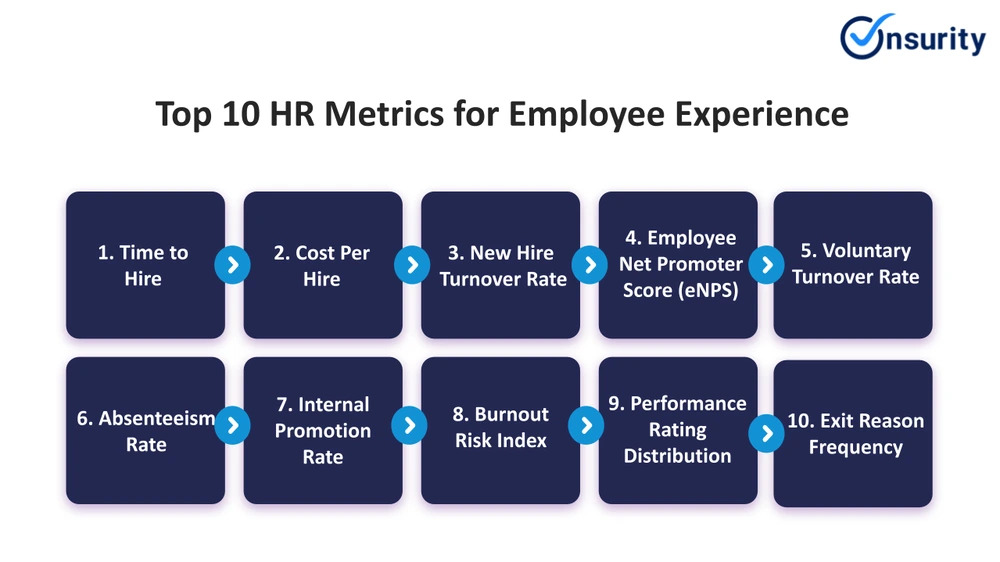
Top 10 Key HR Metrics for Employee Experience
1. Time to Hire
A candidate’s experience begins the moment they apply. If your hiring process takes too long, top-tier talent will likely sign with a faster competitor. Startups rely on momentum, and your recruitment speed should reflect that. A quick, clear process shows that your leadership is decisive and organized. If this number starts to climb, it often suggests that your interviewers are overwhelmed or your job requirements are unrealistic for the current market.
Calculation:
(Sum of (Date of Offer Acceptance − Date of Application)) ÷ Total Number of Hires
2. Cost Per Hire
Startups must be disciplined with their capital. This metric tracks every rupee spent filling a role, including job board fees, recruiter commissions, and the internal time spent on interviews. Hiring a mid-level professional in India can involve high hidden costs that drain your runway if not managed carefully Wisemonk Salary Guide. High costs usually indicate that you are relying too much on outside agencies. Increasing your internal referrals is the most effective way to lower this cost while ensuring better cultural alignment
Calculation:
(Total External Hiring Costs + Total Internal Hiring Costs) ÷ Total Number of Hires
3. New Hire Turnover Rate
When employees leave within their first 90 days, it usually points to a gap between what was promised in the interview and the reality of the job. This is the most important metric for measuring your company’s first impression. A high turnover rate here suggests your onboarding process is failing to integrate new people. Implementing a “Buddy Program” can help, as studies show it can reduce early turnover by up to 30% by providing immediate social support.
Calculation:
(Number of New Hires Who Leave Within First 6 or 12 Months ÷ Total Number of New Hires) × 100
4. Employee Net Promoter Score (eNPS)
This is the most direct way to measure how your team feels. It asks how likely they are to recommend your company as a great place to work. In a competitive tech landscape, a score above 30 is strong, while anything above 50 is world-class. High scores mean your employees are effectively acting as recruiters for you.
Calculation:
eNPS = % Promoters – % Detractors (Promoters are employees who give a 9 or 10 rating because they are happy and loyal; Detractors are those who give a score of 0 to 6 because they are dissatisfied)
5. Voluntary Turnover Rate
Losing high-performers on their own terms is a major warning sign. When your best people choose to leave, it often suggests that your growth opportunities or management quality are no longer hitting the mark. This type of turnover creates “survivor guilt” among those who stay and leads to an increased workload that can quickly burn out the remaining team. Instead of waiting for an exit interview, conduct “stay interviews” to understand what keeps people at the company and strengthen those factors early.
Calculation:
(Number of Voluntary Resignations During a Period ÷ Average Employee Headcount During the Same Period) × 100
Quick read: 10 Best HR Automation Software To Boost Your People Operations
6. Absenteeism Rate
Unexpected absences are often the first sign of a team that is burnt out or disengaged. High absenteeism is the “smoke” that signals a deeper cultural “fire.” It is a clear measure of your organization’s collective health. If a specific team has a sudden spike in absences, it is usually a sign that you need to check in on the leadership style of that team lead.
Calculation:
(Number of Absences / Total Workdays) × 100
7. Internal Promotion Rate
Top talent will leave your startup if they feel there is no room to grow. This metric proves that you value your people’s development. High internal mobility keeps people engaged because they can see a clear future within the company. Aim for a rate of 15-20% to show that there is a path from an individual role to a leadership position.
Calculation:
(Number of Employees Promoted Internally During a Period ÷ Total Number of Employees) × 100
8. Burnout Risk Index
A high-intensity environment should not mean a high-exhaustion environment. This index tracks average overtime and how much vacation time people actually take. If your team uses less than 40% of their leave, they are at high risk of quitting. This index helps you intervene before exhaustion turns into a resignation.
Calculation:
(Average Weekly Work Hours + Percentage of Employees Working Overtime + Frequency of Sick Leaves + Low Wellbeing Survey Scores)
Then normalized on a scale of 0 to 100.
9. Performance Rating Distribution
This metric ensures that your “star” ratings actually mean something. If almost everyone is marked as “Exceeding Expectations” but the company is failing its key targets, your feedback system is broken. High performers get frustrated when they see average performers receiving the same praise and rewards. By tracking the distribution of ratings, you ensure feedback is honest, benchmarks are fair, and excellence is truly recognized.
Calculation:
(Number of Employees in Each Performance Rating Category ÷ Total Number of Rated Employees) × 100
Tracked separately for high, average, and low performance bands.
10. Exit Reason Frequency
Data is only useful if you understand the “why.” This metric categorizes the reasons people leave, such as pay, management, or balance. It shows you exactly where your culture is “leaking.” If “Management” is a top reason for exits, you need to train your leaders rather than just increasing salaries. Actively tracking this allows you to fix structural issues before they cause more talent to leave.
Calculation:
Number of Exits Citing a Specific Reason ÷ Total Number of Exits) × 100
Also read: Employee Experience vs Employee Engagement
Why are HR Metrics Important?
Making the shift from “gut feelings” to data-driven strategy is essential for any professional HR department. When you base your people decisions on hard numbers, you move away from subjective opinions and toward a measurable business impact. Here are the five key advantages of using HR metrics.
1. Attract the Right Talent
Hiring is a major investment. Data helps you find which recruitment channels bring in high performers who add value to your culture. Instead of guessing who might fit in, metrics show you who will actually help the company grow. This ensures your budget is spent on candidates who perform better and stay longer.
2. Boost Productivity
High output happens when employees have the right tools and clear training. Metrics allow you to see where new hires get stuck during their first few weeks. By fixing these specific bottlenecks in the onboarding process, you ensure everyone hits their stride faster. This turns training into a measurable advantage.
3. Enhanced Retention
Losing key talent is expensive and disrupts the whole team. Predictive metrics give leadership the chance to see when a top performer is losing interest long before they actually resign. By tracking engagement levels, you can step in early to solve problems and keep your best people committed to the company.
4. Decreased Absenteeism
Frequent or unplanned leave is usually a sign of a deeper issue. Tracking these patterns helps you spot burnout or management problems before they become permanent. By addressing the root cause of absenteeism, you protect the health of your team and prevent the costs that come with sudden departures.
5. Improved Wellbeing and Satisfaction
There is a direct link between how employees feel and how they treat your customers. When leadership uses data like eNPS to make real changes, it builds trust. Happy and supported employees provide better service to clients, creating a cycle where high internal satisfaction leads to stronger customer loyalty.
Suggested read: 9 Major Roles and Functions of HR Manager
Conclusion: Building the Flywheel of Growth
Tracking these metrics allows you to monitor every critical touchpoint of an employee’s journey. Metrics like Time to Hire and New Hire Turnover act as your front-line defense. They ensure your startup remains a culture of choice for new talent, making you attractive even when competing with the infinite budgets of tech giants.
Once talent is inside, factors like the Internal Promotion Rate and eNPS ensure work satisfaction remains high. This engagement is fuel for dedication. When employees are engaged, their productivity peaks, and this excellence flows directly to your customers. High EX isn’t just an internal win. It results in a superior customer experience (CX) that secures your market position.
This is where a partner like Onsurity becomes a strategic asset. By providing tech-led, comprehensive health and wellness benefits, they help startups proactively manage the Burnout Risk and Absenteeism metrics. When your team feels truly protected and valued through meaningful benefits, their satisfaction metrics rise, attrition falls, and your startup remains a formidable challenger in the 2026 market.
FAQs
1. What are HR metrics?
HR metrics are quantitative data points used to track the effectiveness of an organization’s people strategy. They serve as “vital signs” that monitor the entire employee lifecycle, from recruitment and engagement to retention. In 2026, these metrics are increasingly being used to improve the digital employee experience (DEX) and to move from instinct-based management to data-grounded strategy.
2. Which HR metrics are considered most critical for improving employee experience in a startup?
For a scaling startup, the most critical metrics are eNPS (loyalty and advocacy), the Burnout Risk Index (prevention of stress), and the New Hire Turnover Rate (effectiveness of onboarding). Additionally, the Internal Promotion Rate is essential for demonstrating career growth, which is a top priority for Gen Z and Millennial workers.
3. How should HR metrics be reported?
HR metrics should be reported through interactive, real-time dashboards rather than static spreadsheets. Successful teams in 2026 use tools like Power BI to provide daily updates and visual trends. These reports should be reviewed quarterly by both HR and business leaders to ensure that people goals are aligned with organizational growth and financial objectives.
4. Which HR metrics should a dashboard include?
A high-growth startup dashboard should include a balanced mix of recruitment metrics (Time to Hire, Cost Per Hire), engagement metrics (eNPS, Absenteeism), and stability metrics (Voluntary Turnover, Internal Promotion Rate). It should also monitor predictive indicators like the Burnout Risk Index to allow for proactive management.
5. How do you benchmark HR metrics?
Benchmarking involves comparing your startup’s metrics against industry standards and peers of a similar size and funding stage. For example, while the national average turnover rate is 3.3 percent, a tech startup might benchmark against the 4.75 percent industry average. Data from organizations like SHRM, Gallup, and Gartner provide the baseline for these comparisons.
6. What data sources are needed for reliable HR metrics?
Reliable metrics require data from integrated systems, including Human Resource Information Systems (HRIS), payroll systems, and Applicant Tracking Systems (ATS). Furthermore, qualitative data from employee pulse surveys, onboarding feedback, and exit interviews are essential for providing context to the quantitative numbers.
7. How can we improve poor HR metrics quickly?
Quick improvements can be achieved by closing the feedback loop, letting employees know their input has been heard and acted upon. Implementing automated scheduling for interviews can rapidly reduce Time to Hire, while establishing Peer to Peer recognition programs and modernizing benefits communication can provide an immediate boost to eNPS and employee morale.

Senior Executive – Content
Payal specializes in the healthcare, wellness, and insurtech space, with a strong focus on educating businesses about insurance and employee wellbeing. She is passionate about simplifying an industry that is often misunderstood and filled with complex jargon, translating it into clear and practical insights that organizations can easily understand and act on. Through her work, she aims to make the insurance ecosystem more transparent and accessible, helping businesses recognize that prioritizing employee wellbeing is not just a benefit but a responsibility.